
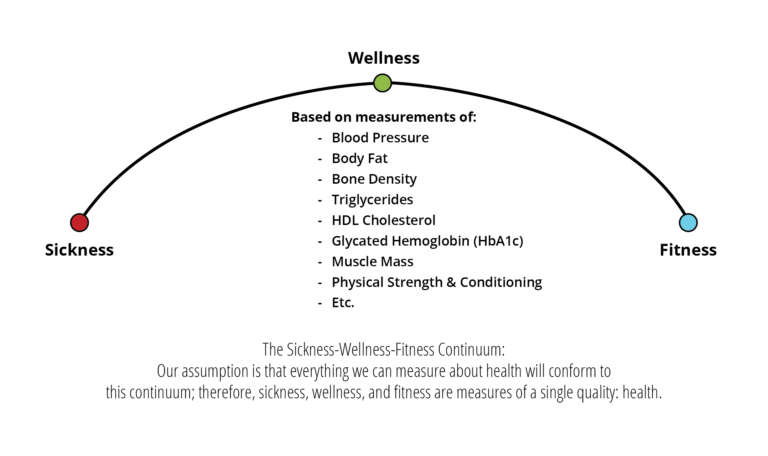
The way we define health is critical to how we pursue it. In the conventional sense, you are either “sick” or “well.” However, a more functional model, championed by organisations like CrossFit, views health as a dynamic spectrum: the Sickness-Wellness-Fitness Continuum.
This model provides a powerful framework for tracking and optimising your well-being, shifting the goal from merely surviving to thriving with significant vitality and resilience.
Defining the Continuum
The continuum ranges from Sickness (Premature Death) on the far left to Fitness (Optimal Health) on the far right. The movement along this line is a direct result of lifestyle, diet, and training choices.
CrossFit provides a precise, functional definition for the end goals:
- Fitness is defined as work capacity across broad time and modal domains—how much power you can generate to perform a wide variety of physical tasks over different durations.
- Health is defined as work capacity across broad time, modal, and age domains—the ability to sustain that fitness and power throughout your lifetime [1].
The goal is not to simply exist in the middle, but to continually expand your work capacity to create a robust, enduring state of health.
The Three Zones: From Normal to Optimal
The continuum establishes three key zones, with a crucial distinction between average health and superior health:
1. Sickness (The Left)
This zone is marked by the presence of one or more chronic diseases (e.g., Type 2 Diabetes, hypertension) and a decline in measurable vital signs. An individual here has minimal physiological reserve.
2. Wellness (The Middle)
This is the state where disease is absent, and your health markers fall within the “normal” or “average” clinical reference ranges.
The key insight from the fitness perspective is that this “normal” range is often misleading. Clinical reference ranges are established by epidemiological studies that estimate where 95% of the “healthy” population falls. However, as population health declines (e.g., obesity rates have significantly increased since the 1960s), these “normal” ranges shift to accommodate sickness [2].
If you are merely “well,” you have very little room for decline before you slip into the Sickness zone.
3. Fitness (The Right / Super-Wellness)
This is the state of Super-Wellness, where disease is absent and your health markers are in the optimal ranges.
Achieving this zone means you have created a physiological buffer or headroom against decline. Your health is so far removed from the average and sick ranges that a significant environmental or biological stressor would need to occur before you even return to the “Wellness” (or normal) range, let alone the Sickness zone.
Tracking Progress: Health and Performance Markers
Movement along the continuum is tracked not just by how you feel, but by measurable data, falling into two categories:
A. Health Markers (Internal Resilience)
These metrics provide insight into your internal systemic health and the risk of chronic disease. Striving to achieve the optimal (“Fitness”) values for these markers is the core of the continuum’s goal:
| Metric | Why It Matters |
| Fasting Blood Sugar & HbA1c | Reflects blood sugar management and risk of metabolic disorders. |
| Lipid Levels (TG/HDL Ratio) | Indicators of cardiovascular health and chronic inflammation. |
| Blood Pressure | A vital sign of cardiovascular stress and function. |
| Body-Fat Percentage / Lean Body Mass | Indicators of body composition crucial for metabolic health and strength [3]. |
| C-Reactive Protein (CRP) | A marker for chronic, systemic inflammation. |
B. Performance Markers (Functional Capacity)
Functional strength and endurance are also critical indicators of your health status. If you can move heavy weights or sustain intense work, you are physically robust and resilient, which correlates directly with long-term health.
Examples of key performance markers include:
- Maximal Strength: Your 1-Rep Max (1RM) on lifts like the Deadlift or Back Squat.
- Endurance/Capacity: Your time to complete benchmark WODs like Fran or your mile run time.
- Gymnastics/Body Control: The number of unbroken pull-ups or ring dips you can perform.
If your performance markers are high (e.g., you can deadlift 2 times your body weight), you are demonstrably operating from a position of optimal fitness, which strongly suggests you also have optimal health and a greater protective buffer against age and disease.
Conclusion: Moving Right
The Illness-Wellness-Fitness Continuum urges a shift from a reactive, symptom-treating mindset (The Treatment Paradigm) to a proactive, performance-and-health-optimising mindset.
Every choice you make—from exercising with intensity to prioritising sleep and high-quality nutrition—is a vote to move yourself further to the right, away from the dangers of the Sickness Zone and into the security of Super-Wellness. Your goal should be to pursue optimal health markers and functional fitness, never settling for what the average population considers “normal.”
References
- CrossFit. (2025). Are You Sick, Well, or Fit? Why You Need to Track Your Health Markers. Retrieved from CrossFit.com
- Giardina, M. (2025). Why Normal Doesn’t Mean Healthy. CrossFit.
- Feito, Y., et al. (2018). Changes in Body Composition, Performance, and Adherence in CrossFit® Participants. Sports, $6(3)$, 58.
Ready to Upgrade Your Fitness?
If you’re looking for the best CrossFit in Wellington, you just found it. At Instinct Fitness, we don’t just run classes—we build capable, resilient humans.
Stop guessing with your training. Book your free No-Sweat Intro today and see why we are the premier Wellington CrossFit gym.
